Bending the Third Rail
Because We Should, We Can, We Do
Cost of the War in Iraq
(JavaScript Error)
Wednesday, November 15, 2006
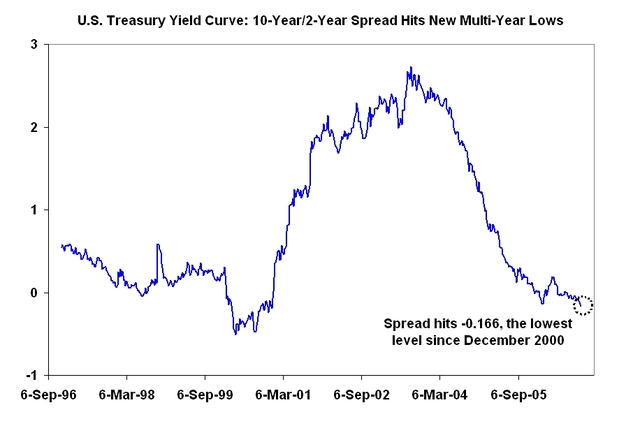
What Kind of Landing?
 Click to enlarge
This is a chart from Barry at The Big Picture. It basically shows the degree of inversion of the yield curve. An inversion occurs when short term interest rates are higher than long term rates. This means that bond traders are betting that long term interest rates are currently at a "high" and that the future holds rate decreases ... meaning a slowing economy.
0 Comments:
About Me
- Name: Greyhair
- Location: Wine Country, California
I'm a very lucky person with every allergy known to man but still happy to be enjoying a wonderful life living in the best place in the world!
Blogroll
The Big PictureBillmon
Blah3.com
Born at the Crest of Empire
Eric Alterman
Eschaton
FireDogLake
Feingold's Blog
Dan Froomkin
The Huffington Post
Hullabaloo
The Illustrated Daily Scribble
Jesus General
Juan Cole
Matilda's Advice and Rants
Mia Culpa
MsJan Quilts
Needlenose
The Oil Drum
Political Animal
Political Wire
Spooks of the Ozarks
Talk About Corruption
TalkLeft
Think Progress
War and Peace
The Washington Note
Other Resources