Bending the Third Rail
Because We Should, We Can, We Do
Cost of the War in Iraq
(JavaScript Error)
Monday, September 25, 2006
Commodity Bubble
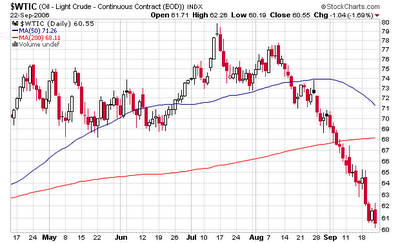
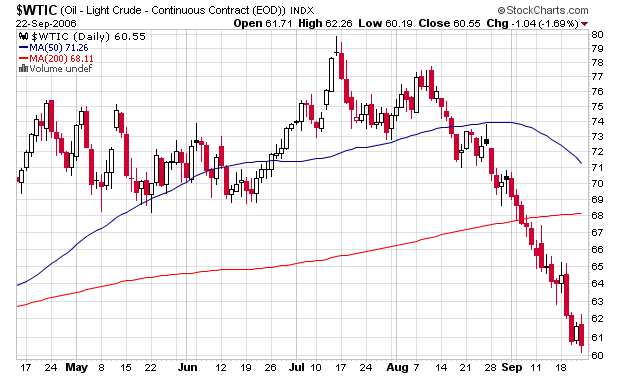
Take a look at this chart for oil prices over the past three years (click to enlarge, hat tip to Barry Ritholtz):
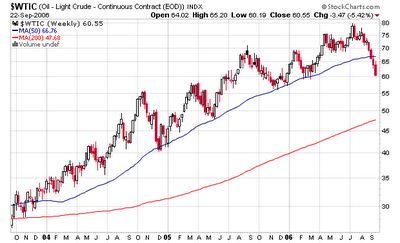
Even more dramatic is the weekly chart:
My my. That's quite a correction going on. Why is this happening?
There is quite a bit of speculation going on, but very little in terms of actual facts to make a case. Some say it's market manipulation ahead of the midterms. I'm not too sure about that as that would require a pretty concerted effort by a lot of greedy people to cause such an action.

Other explanations include that it portends a world economy that is dramatically slowing and the oil markets are predicting a severe recession, that the "hurricane premium" is being removed, that the "terraist premium" is being reduced, that money is rolling out of oil (and commodities in general) and moving into tech stocks, that it's the end of the summer driving season, and on and on and on.
Personally, I think there's a bit of truth in all the explanations. I also think that because it's such a speculative bubble based on emotion, any world events (such as an attack on Iran?) would cause prices to re-escalate to new highs .... quickly. And along the lines of my adaptation theory, note that major support for prices is around $58 / barrel, significantly higher than just a few years ago. I don't think there's any doubt that despite these short term factors, the bull trend in oil will continue until technological changes in energy take hold.
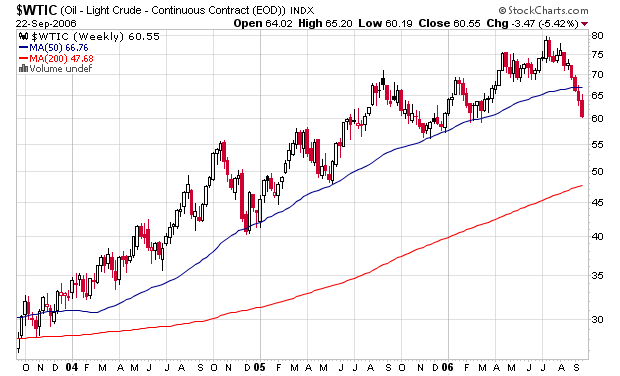
2 Comments:
About Me
- Name: Greyhair
- Location: Wine Country, California
I'm a very lucky person with every allergy known to man but still happy to be enjoying a wonderful life living in the best place in the world!
Blogroll
The Big PictureBillmon
Blah3.com
Born at the Crest of Empire
Eric Alterman
Eschaton
FireDogLake
Feingold's Blog
Dan Froomkin
The Huffington Post
Hullabaloo
The Illustrated Daily Scribble
Jesus General
Juan Cole
Matilda's Advice and Rants
Mia Culpa
MsJan Quilts
Needlenose
The Oil Drum
Political Animal
Political Wire
Spooks of the Ozarks
Talk About Corruption
TalkLeft
Think Progress
War and Peace
The Washington Note
Other Resources
Thanks, also, for the fine blogging you do on the stock market and economy.